A Guide To Know About Mobile App Usage Statistics 2022 For Growth

 Blog Detail Banner
When we got locked in our houses because of the worsening conditions of COVID-19 across the globe smartphones and mobile applications turned out to be a savior during these tough times. This was the only best solution available that solves many problems – to get connected with family members friends through video calls, entertainment (Netflix, Amazon), and meetings (Zoom, Google meet).
This is quite clear that the demand for mobile applications is at an all-time high even in the foreseeable future as this is the only way that fulfills our daily needs. We use applications for many purposes including communication, gaming, education, shopping, banking, etc,. It’s a pretty fact that almost everyone owns a smartphone and its usage is increasing year-over-year.
Latest Blog – Top 7 Programming Languages Developers Prefer For Mobile Applications
Here are some commonly asked questions while building a mobile application –
- Have you ever thought about what attracts people to use or (not use) a mobile app?
- What type of app (entertainment, social) do they like to use most?
- How much time are they spending on using the mobile application?
Are you asking the same questions to yourself? If yes, then this post consists of all the answers to your queries regarding mobile app usage and statistics 2022.
Mobile App Usage Statistics 2022
- Mobile apps are likely to generate nearly $935 billion in terms of revenue by 2023
- 1.96 million apps are available to download on the Apple App Store
- 2.87 million apps are available to download on the Google Play Store
- An average smartphone user uses 10 apps in a day and 30 apps in a single month.
- More than 50 times a day 21% of millennials open an app.
- More than 11 times a day 49% of individuals open an app.
- Nearly 15% of US adults have their own smartphones in 2021
- In 2021, 6.378 billion users accessed smartphones worldwide and are likely to grow by 7.5 billion in 2026.
- On average Americans check their smartphones 262 times a day, almost every 5.5 minutes.
Global Download
It’s fact that people across the globe are using smartphones and tablets. The demand for mobile apps increasing continuously, similarly, the number of app downloads is also increasing worldwide. It’s fact that people across the globe are using smartphones and tablets. The demand for mobile apps increasing continuously, similarly, the number of app downloads is also increasing worldwide.

We can see in the graph (above) that the app downloads increasing year-over-year and this will continue in the foreseeable future. Approximately, 218 billion apps were downloaded in the year 2020 that is approximately a 7% increase from the previous year.
As we can see in the graph a steep growth of 55% between 2016 and 2020. The year-over-year growth is not quite impressive but continuously enhancing with decent figures.
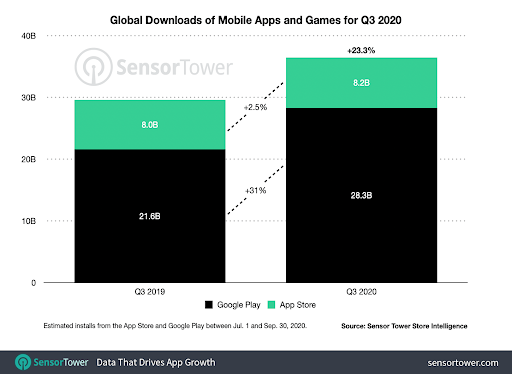
Google Play Store and Apple App Store Downloads Statistics
The majority of people download the application either from Google Play Store or Apple App Store. Apple phone users and Android users download the app respectively from the Apple App Store and Google Play Store. Let’s have a closer look and compare how these platforms perform in terms of global app downloads. The graph is clearly showing that more downloads occur from the Google Play Store worldwide. But, we can see that both stores have performed well in terms of download from 2019 to 2020.
We can see that the Google Play Store downloads were enhanced by 31%, whereas the Apple App store growth rate is just 2.5%. Shortly, more apps have been downloaded from Google Play Store and it is growing at an astonishing rate in every passing year. The same trend to expect to continue in mobile app usage and statistics 2022.
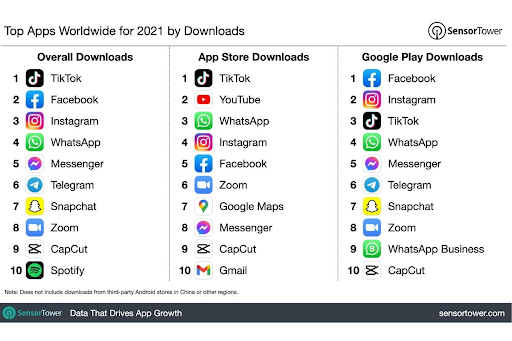
Most Downloaded Apps of 2021 Worldwide
If you are thinking of building a new app then it is important to get knowledge of what types of applications are trending in the app development industry and also identify what consumers want. This is a great way to make your app successful in the market.
You need to understand what types of apps are being downloaded the most as it gives a rough idea of which category of apps is turned out to be beneficial for your business. Here is a list of the most downloaded apps of 2021 that consists of data from both the Apple App Store and Google Play Store.
- TikTok
- Telegram
- Snapchat
- Zoom
- Messenger
- CapCut
- Spotify
Most Popular Apps with Installs Figures
- TikTok was the most downloaded apps of 2021 that surpass 745.9 million downloads across both app stores.
- Facebook secured 1st position on Google Play Store with 500.9 million installs. Nearly, 624.9 million apps were downloaded from both stores, including Google Play and Apple App. The number of downloads in 2021 is (707.8 million) which is 12 percent lesser than in 2020.
Mobile App Usage
After knowing the statistics of downloaded apps worldwide it’s high time to identify how people are using mobile apps. The average user gives around 3 hours and 10 minutes using a smartphone and around 2 hours and 51 minutes on mobile apps.
Research studies have shown that the average smartphone user has installed more than 80 apps on their device. But, it’s not necessary they are using all of them. The average user uses 9 apps in a day and 30 apps in a month. If the user has 80+ apps on their device that means more than 62% of apps are not being used by them every month.
In short, users downloads an enormous number of mobile applications on their device but don’t use all of them. It is a matter of fact that 25% of apps are used only once after their download.
Mobile App Usage By Age
We assume that youth spend more time on mobile apps than the older and this assumption was turned out to be true. But this doesn’t mean we can target old age group people as you can see in the table that people of 65+ age spend nearly 1.7 hours per day and 51.4 hours per month. People between the age group of 55-64 spend almost 2 hours and 31 minutes per day and 69.3 hours per month.
| Age Group | Spend Hours per month per user |
| 65+ | 51.4 |
| 55-64 | 69.3 |
| 45-54 | 75.6 |
| 35-44 | 93.6 |
| 25-34 | 102.4 |
| 18-24 | 112.6 |
Most Popular Categories of Apps of 2021
The success of an app category can be found out from penetration. Here is a list of app categories that have a high rate of penetration among Android and iOS users:-
- Social
- Gaming
- Communication
- Music & Video
- Entertainment
- Retail & Commerce
- Finance
- Educational
- Mobile Browser
- Productivity
- Health & Fitness
- Lifestyle
- Weather
- News
Some of these categories of apps (communication, weather) come preloaded with Android and iOS devices. Apart from that, this gives a hint of what type of apps users have downloaded the most (TikTok, Instagram, Spotify) on their device.
Mobile App Usage By Country
It is fact that the behavior of a person changes by location. As per mobile app usage and statistics 2022, the same concept applies to app usage. In order to be successful in mobile apps, it is essential to get to know how people from different countries of the world are using apps. Thus, it helps to find the target audience and explore new opportunities in the market.
App Downloads By Country
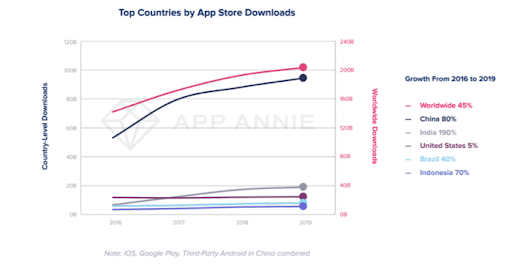
Let’s have a quick look at app store downloads in emerging countries globally The number of app downloads in China grew by 80% in the past four years.
Apart from this, other emerging countries like Indonesia, India, and Brazil also grow at high rates. As we can see in the graph, India’s app download growth rate whoops at 190%, and the United States enhanced by 5%.